Compare Simple atmospheric libradtran with pyextinction
author : Sylvie Dagoret-Campagne
affiliation : IJCLab/IN2P3/CNRS
creation date : 2023/10/20
last update : 2024/11/25 : update with new API of libradtranpy after doubts
[1]:
import numpy as np
import pandas as pd
import os
from scipy import interpolate
from astropy.io import fits
from astropy.table import Table

import pickle
import seaborn as sns
import copy
import astropy.io.fits as F
[2]:
import matplotlib.pyplot as plt
%matplotlib inline

# to enlarge the sizes
params = {'legend.fontsize': 'large',
          'figure.figsize': (16, 8),
         'axes.labelsize': 'xx-large',
         'axes.titlesize':'xx-large',
         'xtick.labelsize':'xx-large',
         'ytick.labelsize':'xx-large'}
plt.rcParams.update(params)
[3]:
from libradtranpy import libsimulateVisible
[4]:
import warnings
warnings.filterwarnings('ignore')
[5]:
def readOzoneTemplatexy(ozoneName,
                      colLbda='LAMBDA', colTrans='OZONE', ext=1):
    """
    Read ozone transmission template, interpolate over
    wavelengthes, and convert to extinction [mag/airmass].

    :param ozoneName: input FITS table, with columns *colLbda*
      (wavelength in AA) and *colTrans* (fractional transmission), and
      key 'REFO3COL' specifing the reference ozone column density [DU]
    :param lbda: output wavelengthes [AA]
    :param colLbda: name of the wavelength (in AA) column
    :param colTrans: name of the ozone transmission column
    :param ext: extension in which to look for wavelength and
      transmission columns
    :return: ozone extinction [mag/airmass], refO3col
    """

    # Read wavelength and transmission columns
    ffile = F.open(ozoneName)
    x = ffile[ext].data.field(colLbda)   # Wavelength
    y = ffile[ext].data.field(colTrans)  # Transmission
    refO3col = ffile[ext].header["REFO3COL"]
    return x,y,refO3col
Configuration
[6]:
WL = np.arange(300.,1100.)
[7]:
AIRMASSMIN=1.0
AIRMASSMAX=2.6
DAM = 0.2
airmasses = np.arange(AIRMASSMIN,AIRMASSMAX,DAM)
NAM=len(airmasses)
[8]:
PWVMIN = 0
PWVMAX = 11
DPWV = 0.5
pwvs = np.arange(PWVMIN,PWVMAX,DPWV)
NPWV = len(pwvs)
[9]:
OZMIN = 0
OZMAX = 600
DOZ   = 50
ozs = np.arange(OZMIN,OZMAX,DOZ)
NOZ = len(ozs)
[10]:
hls_colors = sns.color_palette("hls", NAM)
sns.palplot(hls_colors)

PyExtinction initialisation
[11]:
from pyextinction.AtmosphericExtinction import ExtinctionModel,EXT2OPT
[12]:
pyExt_model = ExtinctionModel(WL*10.)
[13]:
# Default ozone template
#pyE_O3Template = os.path.join(os.path.dirname(os.path.abspath(__file__)),'o3data/ozoneTemplate.fits')
pyE_O3Template = '/Users/dagoret/MacOSX/GitHub/LSST/AtmosphericSimulation/libradtranpy/src/pyextinction/o3data/ozoneTemplate.fits'
[14]:
pyE_press = 740
pyE_o3 = 600.
pyE_tau = 0.05
pyE_ang = 1.3
pyE_pars = np.array([pyE_press,pyE_o3,pyE_tau,pyE_ang])
pyE_label1='pyExt Rayleigh [%.0f mbar]' % pyE_press
pyE_label2='pyExt Ozone [%.0f DU]' % pyE_o3
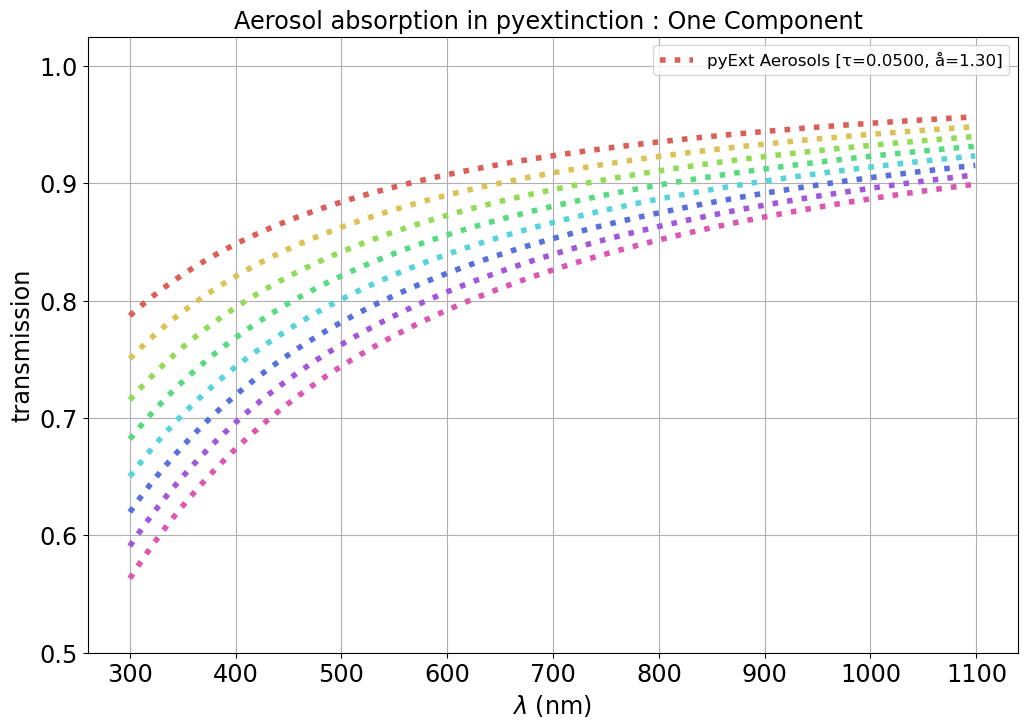
pyE_label3=u'pyExt Aerosols [τ=%.4f, å=%.2f]' % (pyE_tau, pyE_ang)
pyE_all_labels = [pyE_label1,pyE_label2,pyE_label3]
[15]:
pyExt_model.setParams(pyE_pars, dpars=None)
pyE_components_extinctions = pyExt_model.extinctionComponents()
pyE_opticalindexes = EXT2OPT * pyE_components_extinctions
[16]:
pyE_xO3ref,pyE_yO3ref,pyE_refO3col = readOzoneTemplatexy(pyE_O3Template)
pyE_labelO3_ref = f"pyExt Ozone ref {pyE_refO3col} DU"
[17]:
pyExt_model.__str__()
[17]:
'Wavelength domain: 3000.0-10990.0 A by step of 10.0 A (800 px)\nOzone template: /Users/dagoret/MacOSX/GitHub/LSST/AtmosphericSimulation/AtmEmulator/src/pyextinction/o3data/ozoneTemplate.fits (265.0 DU)\nAerosol reference wavelength: 10000 A\nInput extinction parameters:\n Pressure: 740 +/- 0 mbar\n Ozone: 600 +/- 0 DU\n Aerosols: optical depth @ refLbda: 0.05 +/- 0\n angstrom exponent: 1.30 +/- 0.00\n'
Check emulator with Rayleigh scattering
[18]:
pressure = 0. # use default value
pwv=4       # turn on or of the pwv
aer=0
ozone=0.    # turn on or of the ozone
cloudext=0
[ ]:
[19]:
fig = plt.figure(figsize=(12,8))
ax=fig.add_subplot()
for idx,am in enumerate(airmasses):

    #path,thefile=libsimulateVisible.ProcessSimulation(am,pwv,ozone,pressure,
    #                                                  prof_str='us',proc_str='sc',cloudext=cloudext
    #data = np.loadtxt(os.path.join(path,thefile))
    #wl = data[:,0]
    #transm = data[:,1]

    wl,transm=libsimulateVisible.ProcessSimulation(am,pwv,ozone,pressure,aer_num=aer,prof_str='us',proc_str='sc',cloudext=cloudext)

    label = f"libRad : z = {am:.1f}"
    ax.plot(wl,transm,'-',color=hls_colors[idx],label=label,lw=1)
    if idx==0:
        ax.plot(WL,np.exp(-pyE_opticalindexes[0,:]*am),":",color=hls_colors[idx],lw=4,label=pyE_label1)
    else:
        ax.plot(WL,np.exp(-pyE_opticalindexes[0,:]*am),":",color=hls_colors[idx],lw=4)
ax.set_ylabel("Component transmission")
ax.set_xlabel("$\\lambda$ (nm)")
ax.legend()
ax.set_title("Rayleigh Scattering libradtran/pyExtinction")
ax.grid()

Check emulator with Ozone absorption
[20]:
hls_colors = sns.color_palette("hls", NOZ)
sns.palplot(hls_colors)

[21]:
airmass = 1
pressure = 0. # use default value
pwv=0       # turn on or of the pwv
aer=0
ozone=0.    # turn on or of the ozone
cloudext=0
[22]:
fig = plt.figure(figsize=(12,8))
ax=fig.add_subplot()
for idx,oz in enumerate(ozs):

    #path,thefile=libsimulateVisible.ProcessSimulation(airmass,pwv,oz,pressure,prof_str='us',proc_str='ab',cloudext=cloudext)
    #data = np.loadtxt(os.path.join(path,thefile))
    #wl = data[:,0]
    #transm = data[:,1]

    wl,transm=libsimulateVisible.ProcessSimulation(airmass,pwv,oz,pressure,aer_num=aer,prof_str='us',proc_str='ab',cloudext=cloudext)

    label = f"libRad : oz = {oz:.0f} DU"
    ax.plot(wl,transm,color=hls_colors[idx],label=label)

ax.plot(WL,np.exp(-pyE_opticalindexes[1,:]),color="grey",label=pyE_label2,lw=2)

ax.plot(pyE_xO3ref/10,pyE_yO3ref,color="k",label=pyE_labelO3_ref,lw=2)

ax.set_ylabel("transmission")
ax.set_xlabel("$\\lambda$ (nm)")
ax.legend()
ax.set_title(f"Ozone absorption libradtran/pyExtinction, am = {airmass:.1f}")
ax.grid()
ax.set_ylim(0.9,1.025)
[22]:
(0.9, 1.025)

Ozone at different airmasses
[23]:
hls_colors = sns.color_palette("hls", NAM)
sns.palplot(hls_colors)

[24]:
pyE_refO3col
[24]:
265.0
[25]:
pyE_pars = np.array([pyE_press,pyE_refO3col,pyE_tau,pyE_ang])
pyE_label1='pyExt Rayleigh [%.0f mbar]' % pyE_press
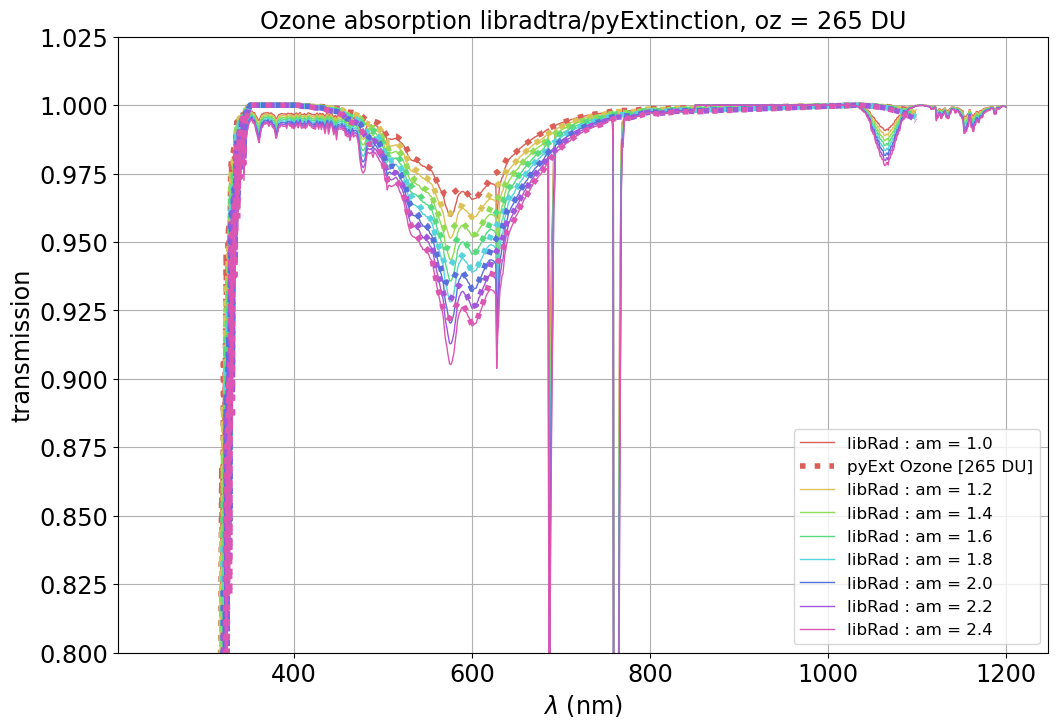
pyE_label2='pyExt Ozone [%.0f DU]' % pyE_refO3col
pyE_label3=u'pyExt Aerosols [τ=%.4f, å=%.2f]' % (pyE_tau, pyE_ang)
pyE_all_labels = [pyE_label1,pyE_label2,pyE_label3]
pyExt_model.setParams(pyE_pars, dpars=None)
pyE_components_extinctions = pyExt_model.extinctionComponents()
pyE_opticalindexes = EXT2OPT * pyE_components_extinctions
[26]:
oz= pyE_refO3col
fig = plt.figure(figsize=(12,8))
ax=fig.add_subplot()

for idx,am in enumerate(airmasses):


    #path,thefile=libsimulateVisible.ProcessSimulation(am,pwv,oz,pressure,prof_str='us',proc_str='ab',cloudext=cloudext)
    #data = np.loadtxt(os.path.join(path,thefile))
    #wl = data[:,0]
    #transm = data[:,1]


    wl,transm=libsimulateVisible.ProcessSimulation(am,pwv,oz,pressure,aer_num=aer,prof_str='us',proc_str='ab',cloudext=cloudext)

    label = f"libRad : am = {am:.1f}"
    ax.plot(wl,transm,'-',color=hls_colors[idx],label=label,lw=1)

    if idx ==0:
        ax.plot(WL,np.exp(-pyE_opticalindexes[1,:]*am),':',color=hls_colors[idx],label=pyE_label2,lw=4)
    else:

        ax.plot(WL,np.exp(-pyE_opticalindexes[1,:]*am),':',color=hls_colors[idx],lw=4)


ax.set_ylabel("transmission")
ax.set_xlabel("$\\lambda$ (nm)")
ax.legend()
ax.set_title(f"Ozone absorption libradtra/pyExtinction, oz = {oz:.0f} DU")
ax.grid()
ax.set_ylim(0.8,1.025)
[26]:
(0.8, 1.025)
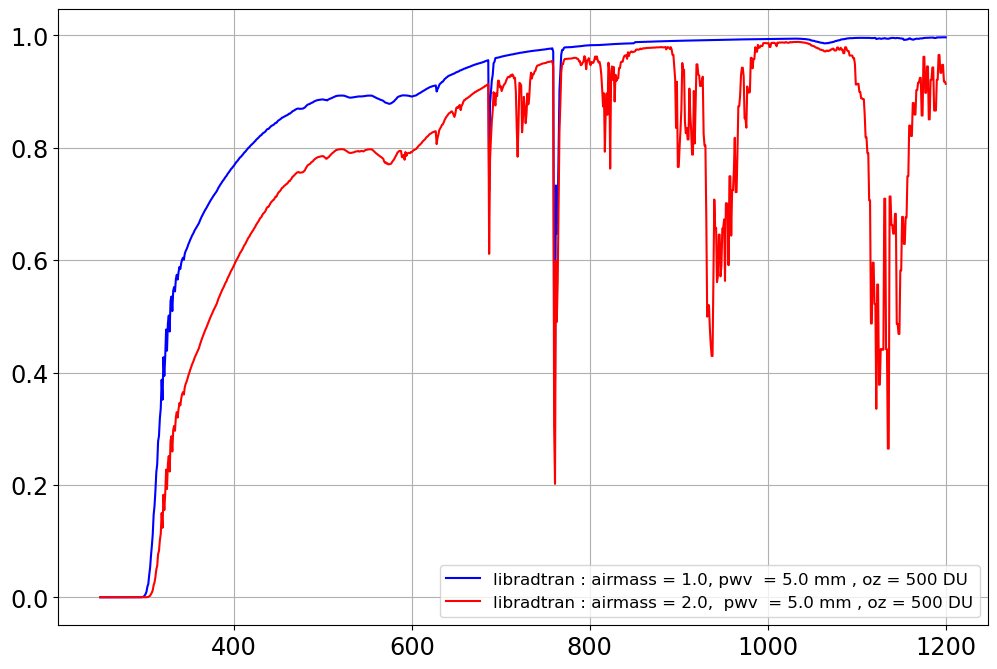
Check libratran with combined scattering and absorption processes
[27]:
am0 = 1.0
pwv0 = 5.0
oz0 = 500.
#path,thefile=libsimulateVisible.ProcessSimulation(am0,pwv,oz0,pressure,
#                                                      prof_str='us',proc_str='sa',cloudext=cloudext)
#data = np.loadtxt(os.path.join(path,thefile))
#wl1 = data[:,0]
#transm1 = data[:,1]

wl1,transm1=libsimulateVisible.ProcessSimulation(am0,pwv,oz0,pressure,aer_num=aer,prof_str='us',proc_str='sa',cloudext=cloudext)

label0=f"libradtran : airmass = {am0:.1f}, pwv  = {pwv0:.1f} mm , oz = {oz0:.0f} DU"
[28]:
am1 = 2.0
pwv1 = 5.0
oz1 = 500.
#path,thefile=libsimulateVisible.ProcessSimulation(am1,pwv1,oz1,pressure,
#                                                      prof_str='us',proc_str='sa',cloudext=cloudext)
#data = np.loadtxt(os.path.join(path,thefile))
#wl2 = data[:,0]
#transm2 = data[:,1]

wl2,transm2=libsimulateVisible.ProcessSimulation(am1,pwv1,oz1,pressure,aer_num=aer,prof_str='us',proc_str='sa',cloudext=cloudext)

label1=f"libradtran : airmass = {am1:.1f},  pwv  = {pwv1:.1f} mm , oz = {oz1:.0f} DU"
[29]:
fig = plt.figure(figsize=(12,8))
ax=fig.add_subplot()
ax.plot(wl1,transm1,'b-',label=label0)
ax.plot(wl2,transm2,'r-',label=label1)
ax.legend()
ax.grid()
Check with aerosols
\[OD = \tau \left( \frac{\lambda_{ref}}{\lambda} \right)^a\]
[30]:
hls_colors = sns.color_palette("hls", NAM)
sns.palplot(hls_colors)
Parameters for pyExtinction
[31]:
pyE_tau = 0.05
pyE_ang = 1.3
Convert aerosols parameters for AtmEmulator
not same reference wavelength
[32]:
taus = [pyE_tau*(1000./550.)**pyE_ang ]
betas = [- pyE_ang]
ncomp=1
[33]:
fig = plt.figure(figsize=(12,8))
ax=fig.add_subplot()

for idx,am in enumerate(airmasses):

    if idx==0:
        ax.plot(WL,np.exp(-pyE_opticalindexes[2,:]*am),":",color=hls_colors[idx],lw=4,label=pyE_label3)
    else:
        ax.plot(WL,np.exp(-pyE_opticalindexes[2,:]*am),":",color=hls_colors[idx],lw=4)
ax.set_ylim(0.5,1.025)
ax.set_ylabel("transmission")
ax.set_xlabel("$\\lambda$ (nm)")
ax.legend()
ax.set_title(f"Aerosol absorption in pyextinction : One Component ")
ax.grid()